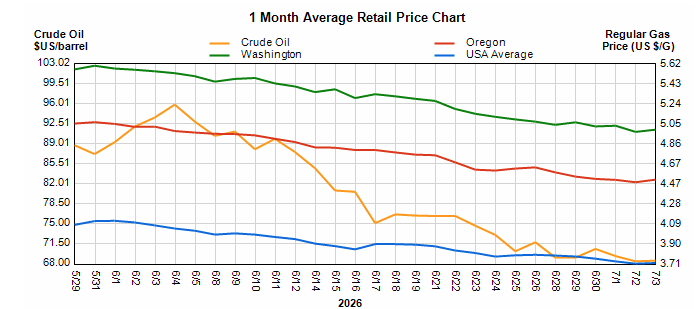
1 Month Average Retail Price Chart: trends May–early July 2026 for crude oil (orange), Washington (green), Oregon (red), USA average (blue), and regular gas price (blue/gal). Left axis: crude oil $/barrel (roughly 68–103); right axis: gas price $/gal (roughly 3.71–5.62). Green line gradually declines; orange drops after mid‑June; red remains steady; blue USA average hovers near the gas price axis.