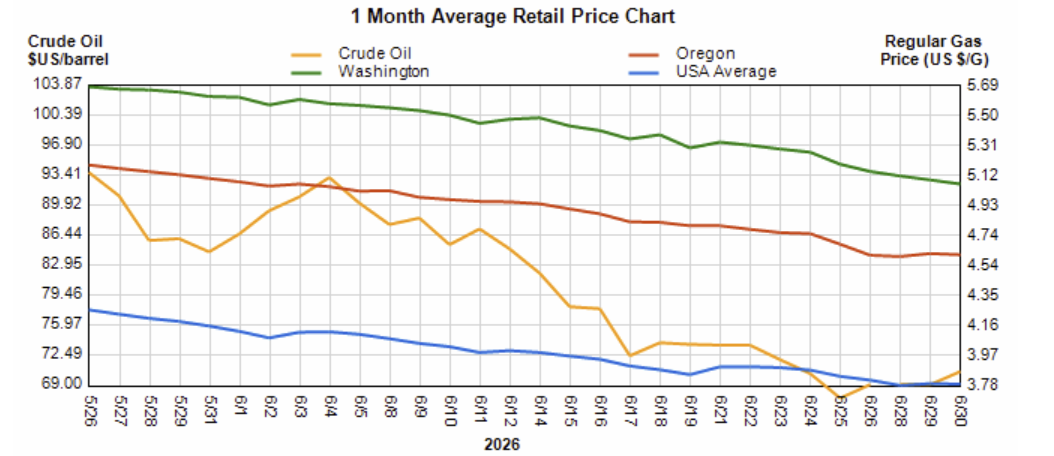
Line chart titled '1 Month Average Retail Price Chart' showing prices over 2026: Crude Oil per barrel (orange, left axis) and Regular Gas Price (right axis) for USA Average (blue), Washington (green), and Oregon (red). Trends show gas prices gradually decline across all regions; crude oil fluctuates with an overall downward trend.